Returning to making clots one year later
It has been almost one year (267 days if my lab book is to be trusted) since I last fabricated a fibrin clot in vitro. Time to don my gloves and goggles and see what one year of refrigeration has done to my reagents and what one year of inactivity has done to my skills in the wet lab.
Part I
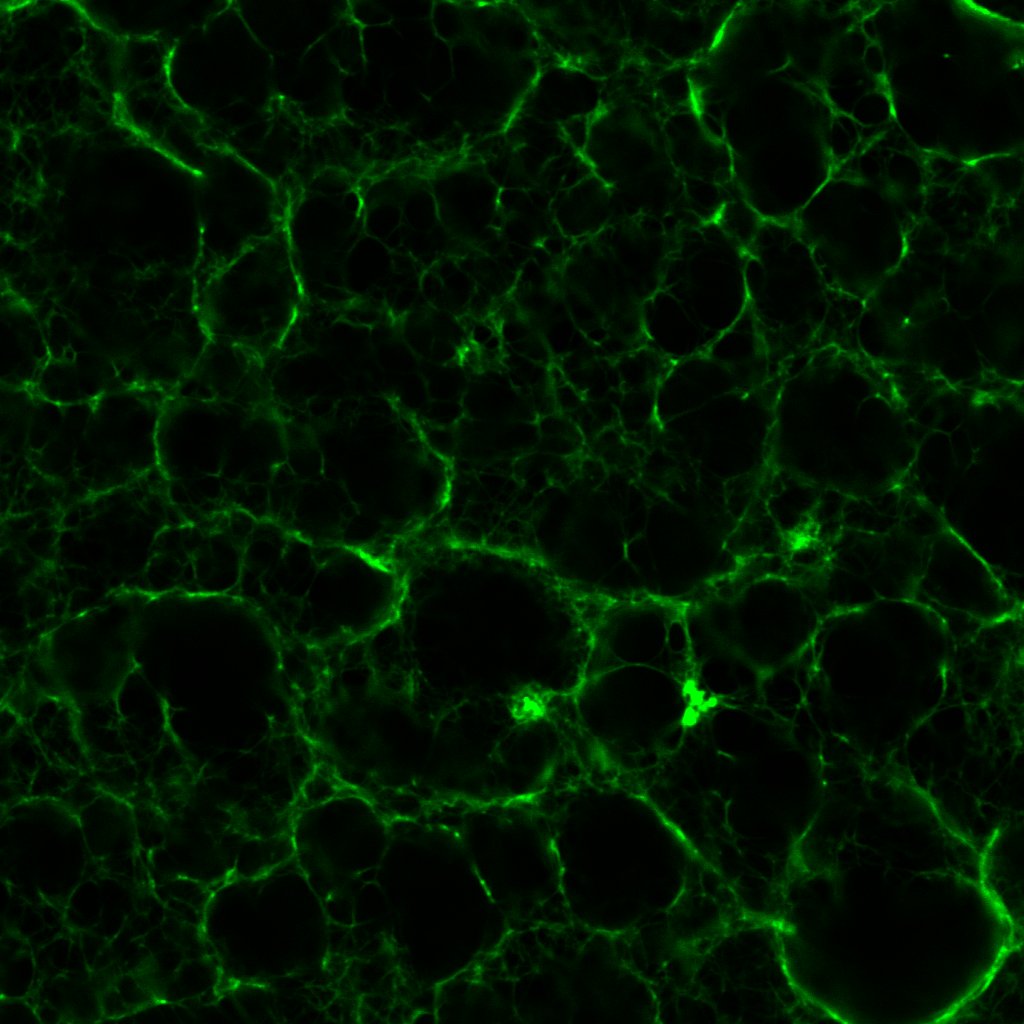
I began by making a clot with 0.5 un/mL thrombin, the main purpose of which was to validate both the integrity of my -20°C-frozen reagents as well as my clot-making techniques; specifically, whether I can reproduce the clot density and porosity that I saw last year.
Here’s the result:
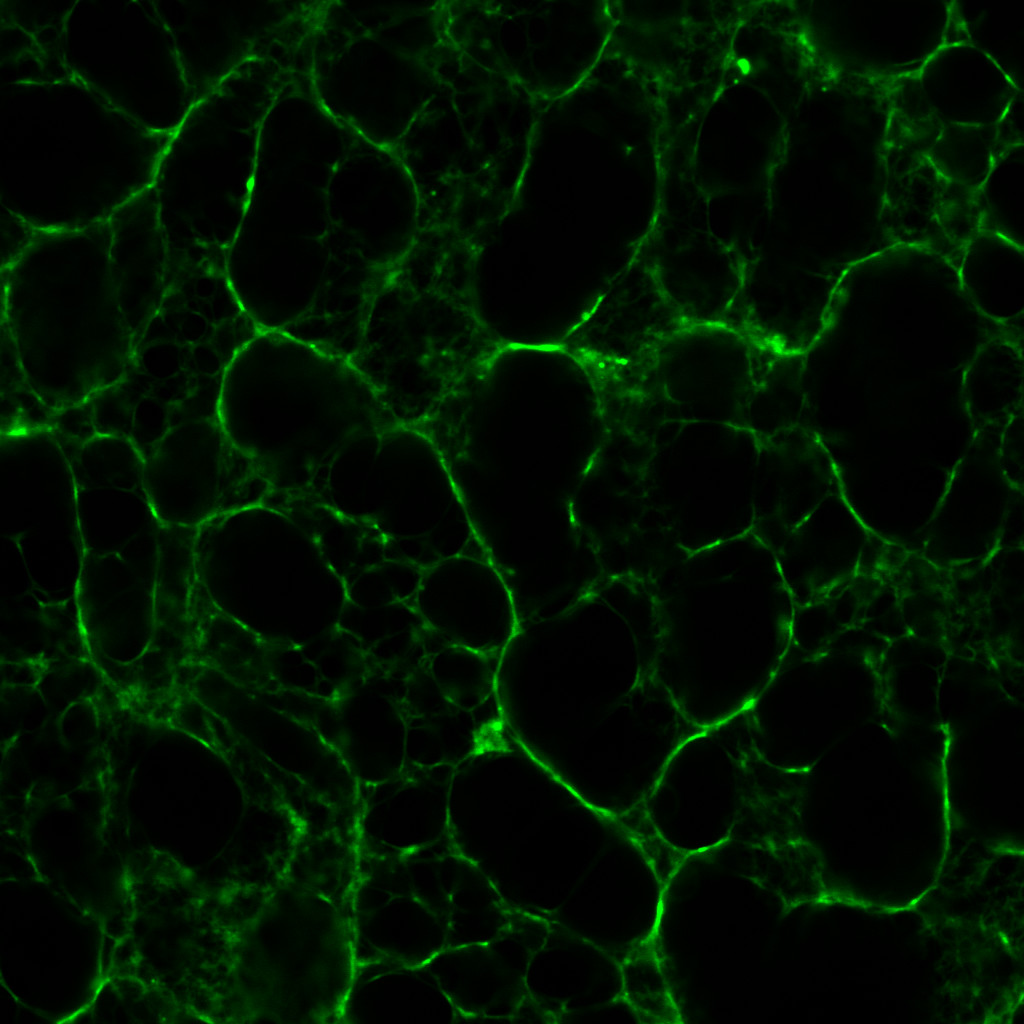
Now compare and contrast this with one I made last year, with the same (though arguably fresher) reagents from an identical thrombin concentration:
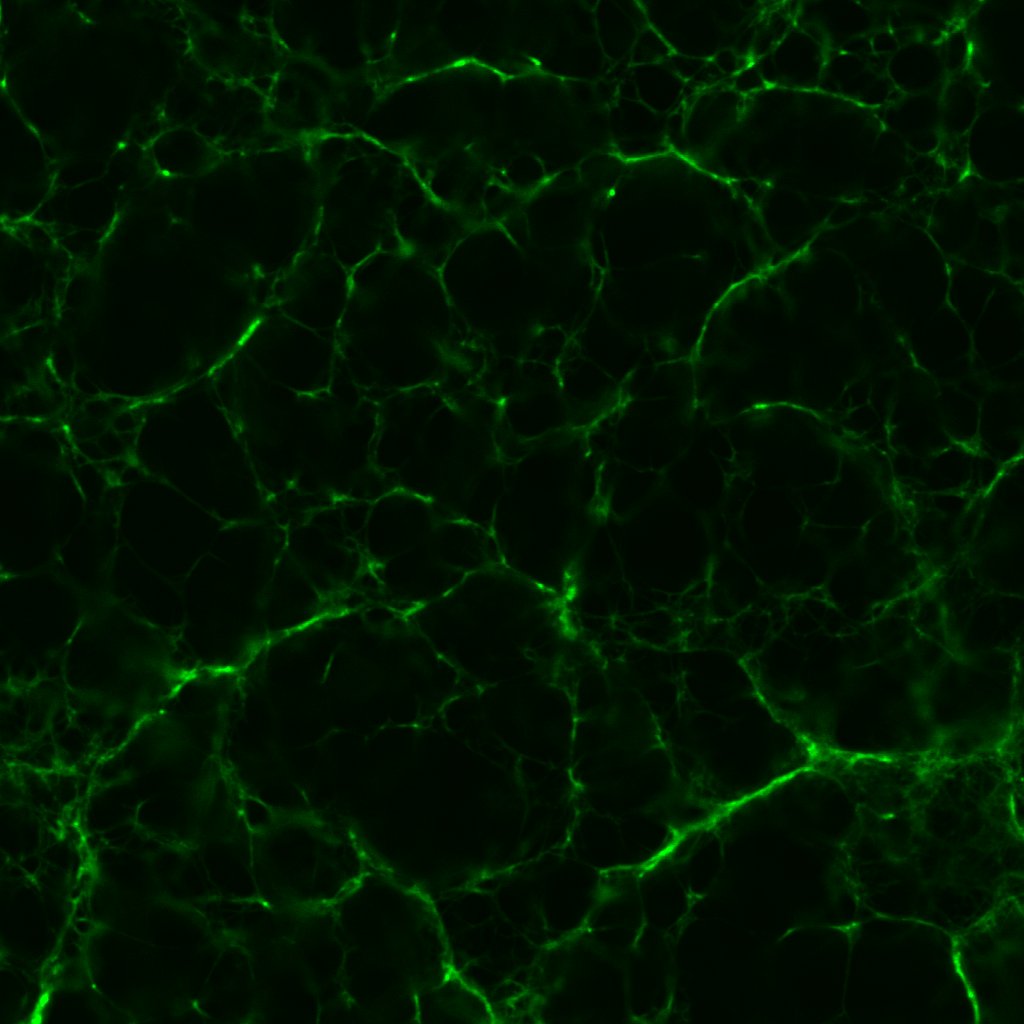
The fibrin to my eyes has retained a similar structure. The fibrils are brightly fluorescent and well-defined—fibrils with a beaten-up appearance are often characteristic of reagents past their useful lives. It is astonishing how long proteins can remain viable if refrigerated properly.
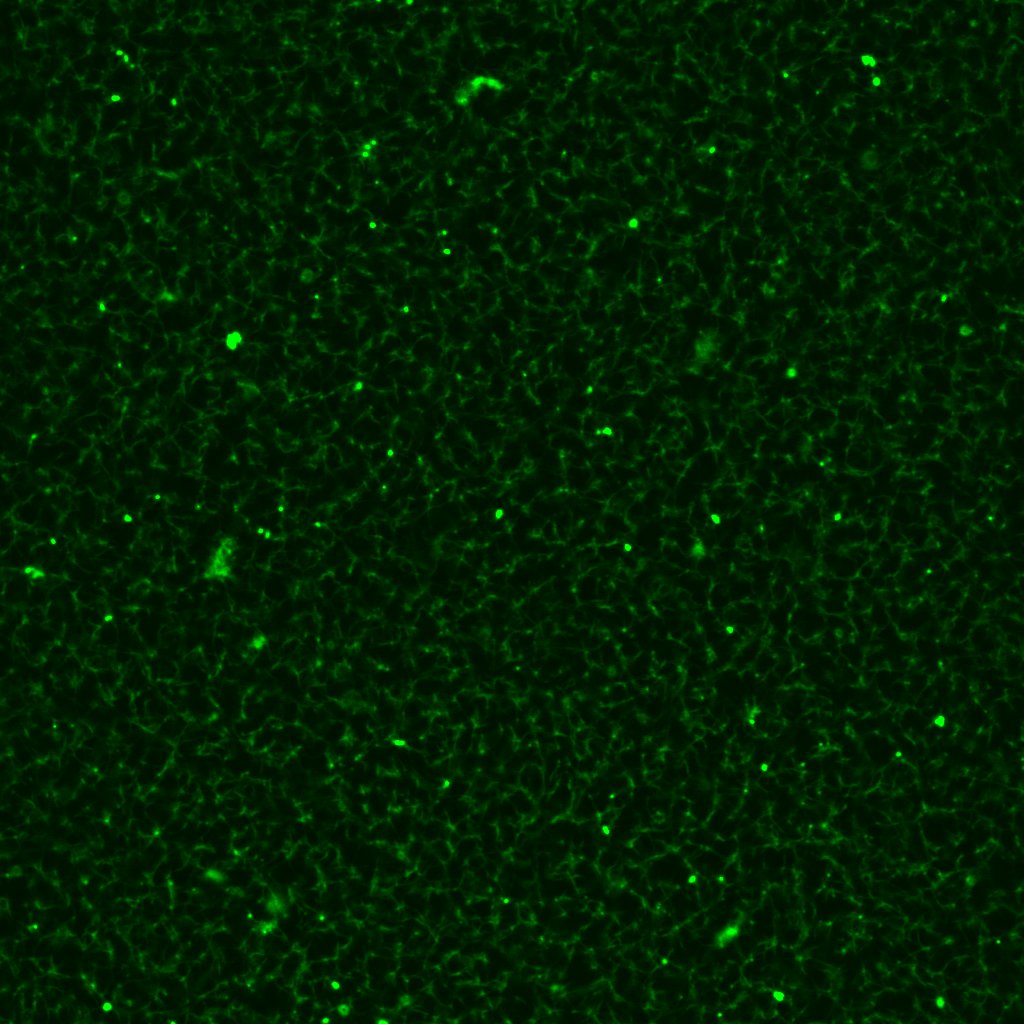
The pores in figure 1 are ever-so slightly larger than those in figure 2. This being the case, I fashioned another series of clots out of 0.1 un/mL, 0.5 un/mL and 1.0 un/mL thrombin. Which was just as well considering the rather surprising results.
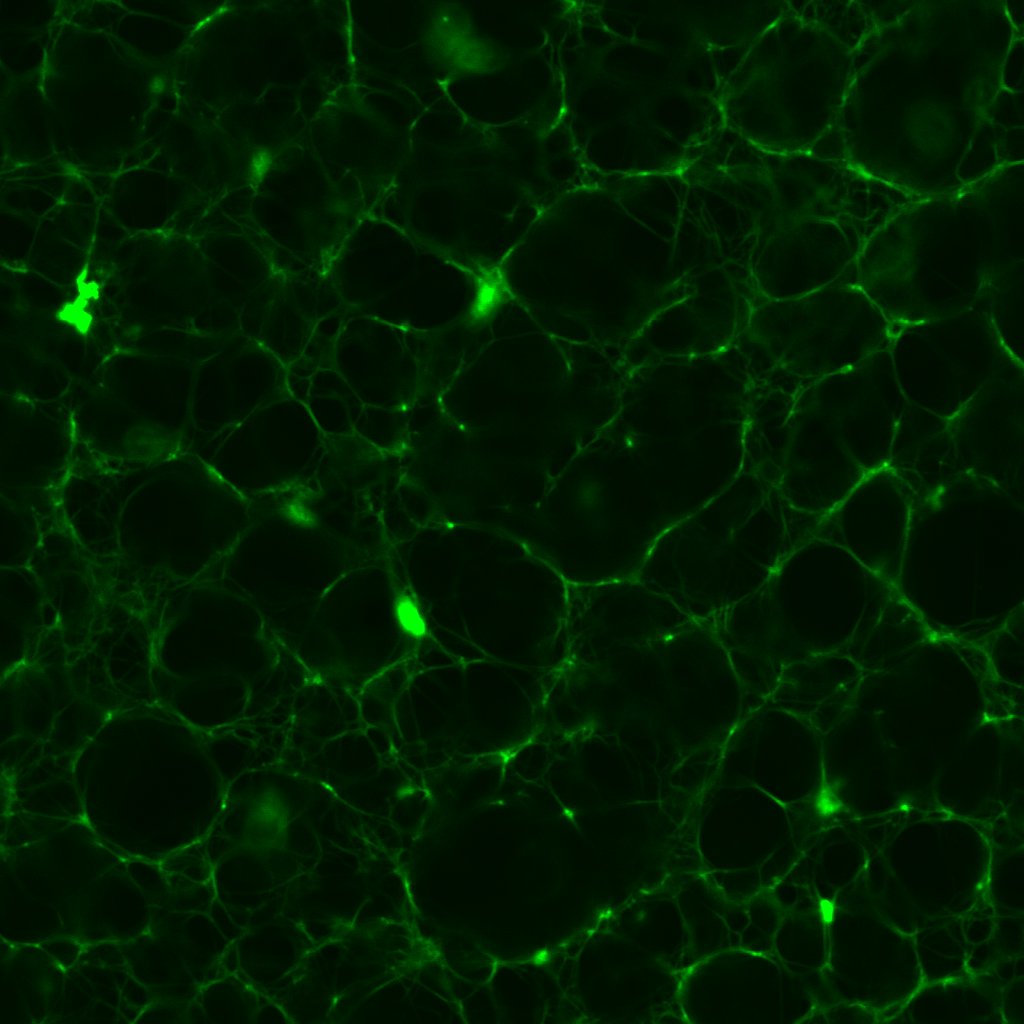
These images sounded a siren in my head. Progressively higher concentrations of thrombin should produce fibrin clots with dramatically higher densities and lower porosities, as this post shows. Seen here, the 0.1 and 1.0 un/mL clots have similar densities; meanwhile the 0.5 un/mL clot turns out to be the densest.
This prompted me to revisit some of the earliest confocal micrographs I imaged last year. I will not inflict them on you, but suffice it to say, I discovered there was more variation in the density of clots than I dared or cared to admit. Of course, the final series of clots I fabricated last year did exhibit the anticipated gradation in structure, which I took as confirmation of my results. I would call this a classic case of confirmation bias!
There are several potential explanations for this variability, chief amongst which is the minuscule volume of thrombin required. To produce a 100μL volume of clot sample with a final thrombin concentration of 1.0 un/mL, only 10μL of thrombin is needed; whereas only 1μL of thrombin is needed to make a sample with 0.1un/mL final thrombin concentration.
For one, dispensing volumes this small requires using a micropipette with an appropriate volume range. Though I had access to a 0.1–10μL micropipette, I might not have used it consistently. (Micropipettes can often be set to volumes beyond their recommended range, so for convenience I sometimes used a micropipette designed for the 2–20μL range.)
More critically, in a microtube, 1–10μL of thrombin solution is no more than a small droplet. Previously, I would mix the fibrinogen, Alexa Fluor 488 and Tris buffer in one microtube, thrombin and CaCl2 in another, before transferring the contents of one microtube (usually thrombin and CaCl2) to the other using a micropipette. In retrospect, such a workflow is almost unthinkable; even perfect pipetting technique is bound to leave some thrombin and CaCl2 behind, and a different amount every time. Thus it is entirely plausible that of the 5μL of thrombin I intended to transfer for instance, only 2μL is actually transferred to the fibrinogen microtube. As we saw in this post, clot structure is highly sensitive to tiny changes in thrombin concentration, so even a few microlitres could account for the unexpected variations in figures 3, 4 and 5.
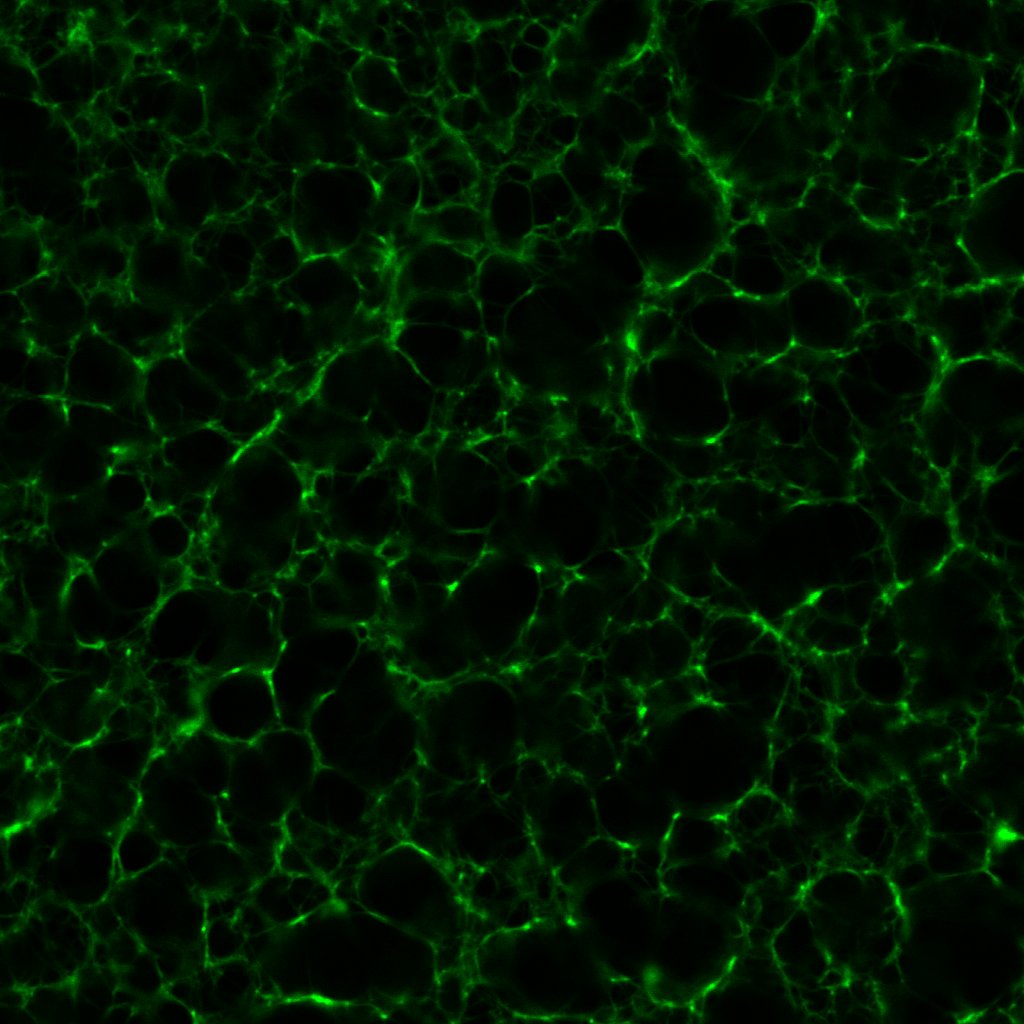
These reflections prompted me to come up with an alternative mixing process. The fibrinogen, Alexa Fluor and Tris would be prepared just as before. Now though, instead of dispensing CaCl2 to a separate microtube, I dispense it into the fibrinogen microtube directly. When the chamber on the microscope slide is ready, I remove thrombin from its ice chest and pipette the requisite volume directly into the fibrinogen microtube using the 0.1–10μL micropipette, before transferring the resulting 100μL mixture into the slide chamber, where the fibrin is allowed to clot.
With these modifications in mind, I re-fabricated a 1.0un/mL clot. The result turned out exactly as it should:
Part II
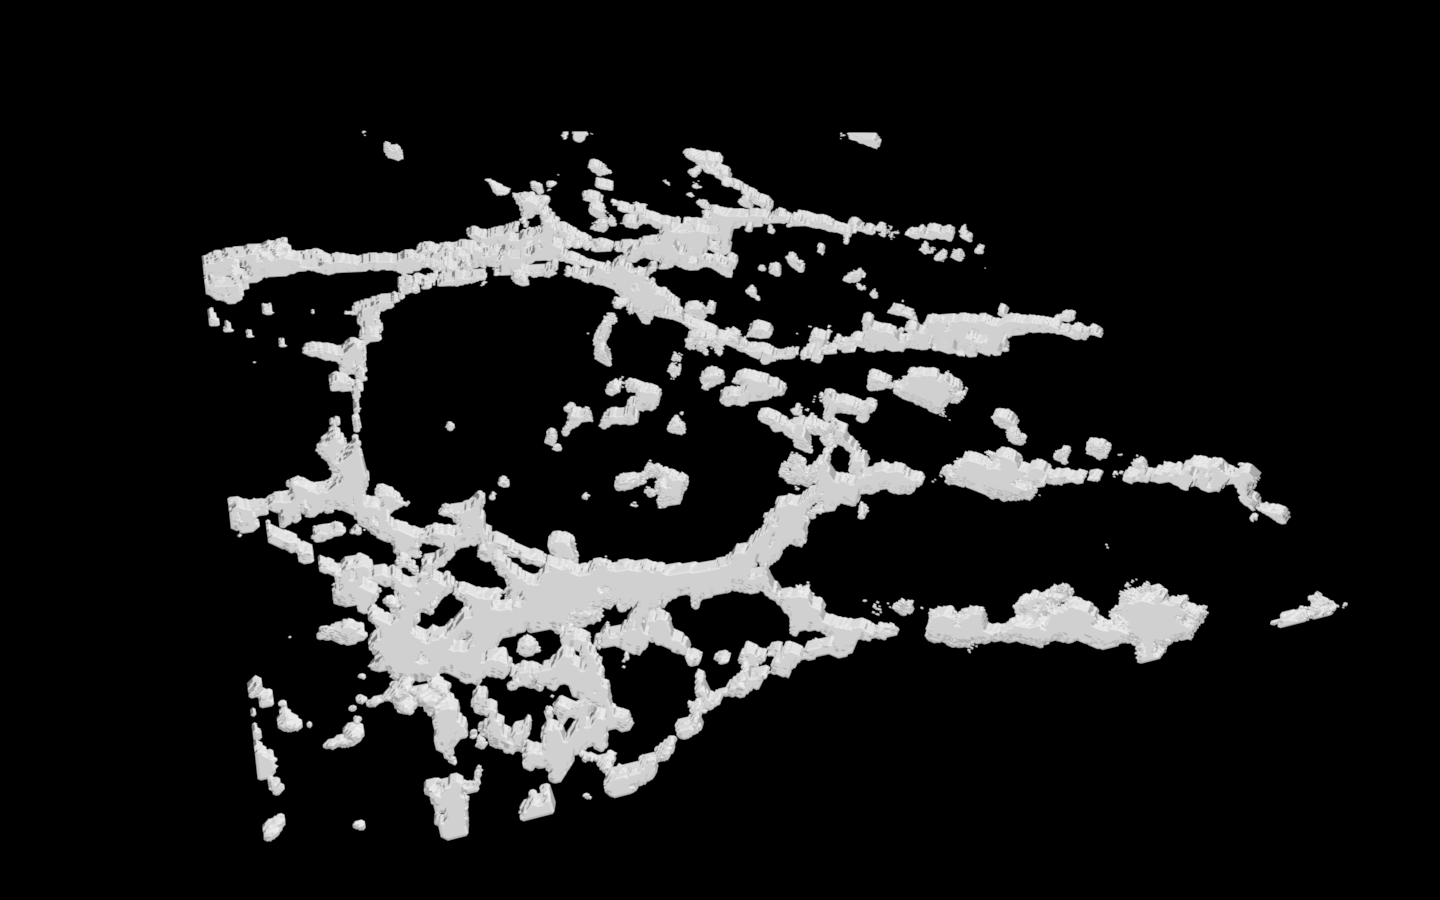
One of the features of all the clots that I have imaged and 3D printed thus far that continues to bother me are the flat surfaces and thick clumps visible from the sides, e.g. figure 7.
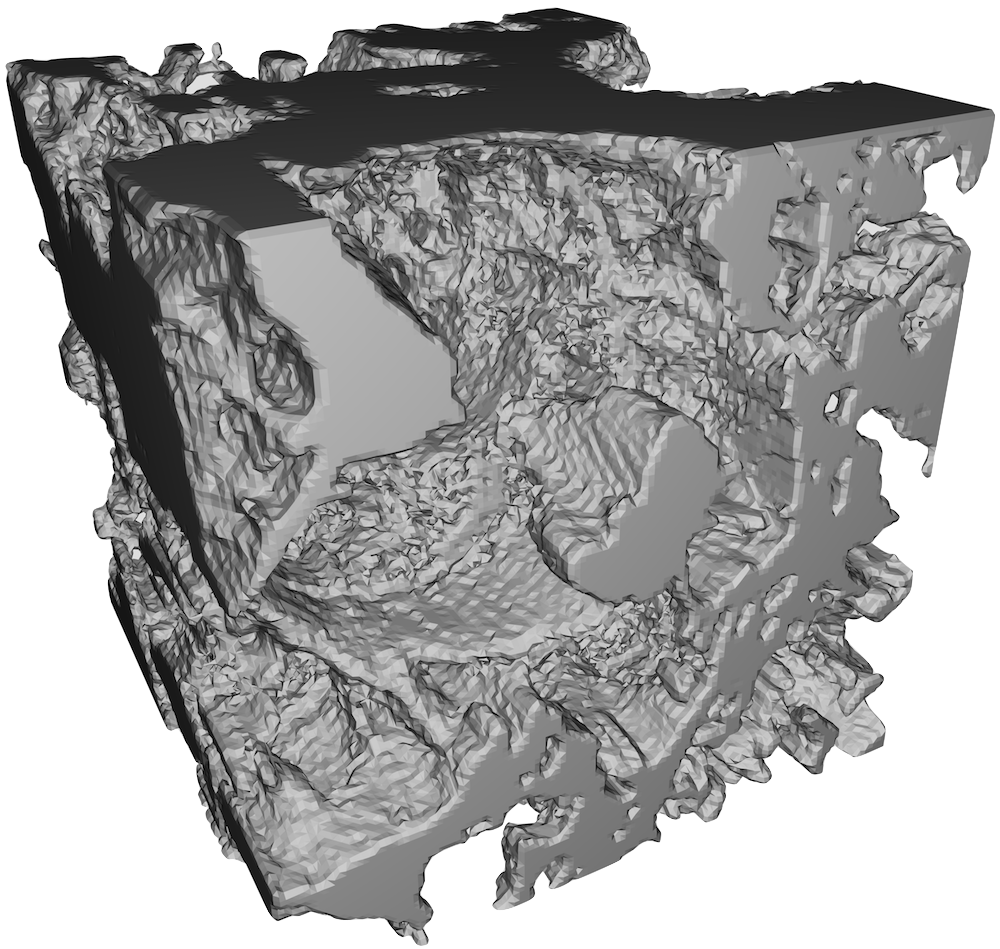
The clots generally look isotropic and homogeneous in the xy-plane, but appear to have some directional preference for the z-axis. Certainly one would not expect this phenomenon to occur in vivo; the interior of a blood clot, far away from the vascular wall, does not have a special direction. N.B. Capillaries which are red blood cell-sized could violate this condition. It could be a different story in vitro however. In particular, the slide chambers I prepare are roughly 1cm wide in the x- and y-directions, but only 3 layes of double-sided tape deep in the z-direction. If the surface to which the clot attaches is not symmetric, it is not inconceivable that there is a favoured direction in the clot.
One way to test this hypothesis is of course to make a symmetric sample, i.e. one that is roughly 1cm deep. However such a sample requires 10 times as much thrombin—not very economical. A thick sample introduces additional complications related to microscope imaging. The alternative is to prepare a chamber still 3 layers of doubled-sided tape thick (~1mm), but roughly 1mm wide in the x- and y-directions as well.
The first slide I made incorporating this modification turned out to have no sample in the chamber at all. It was simply too difficult to inject the fibrin solution into the tiny opening of the chamber, even armed with the smallest micropipette tip. A concession had to be made, so for the next four slides, I widened the gap between the taped sides of the chamber from 1mm to 2mm, approximately.
Under the confocal microscope, only one of the four slides contained enough clot to be worth imaging.
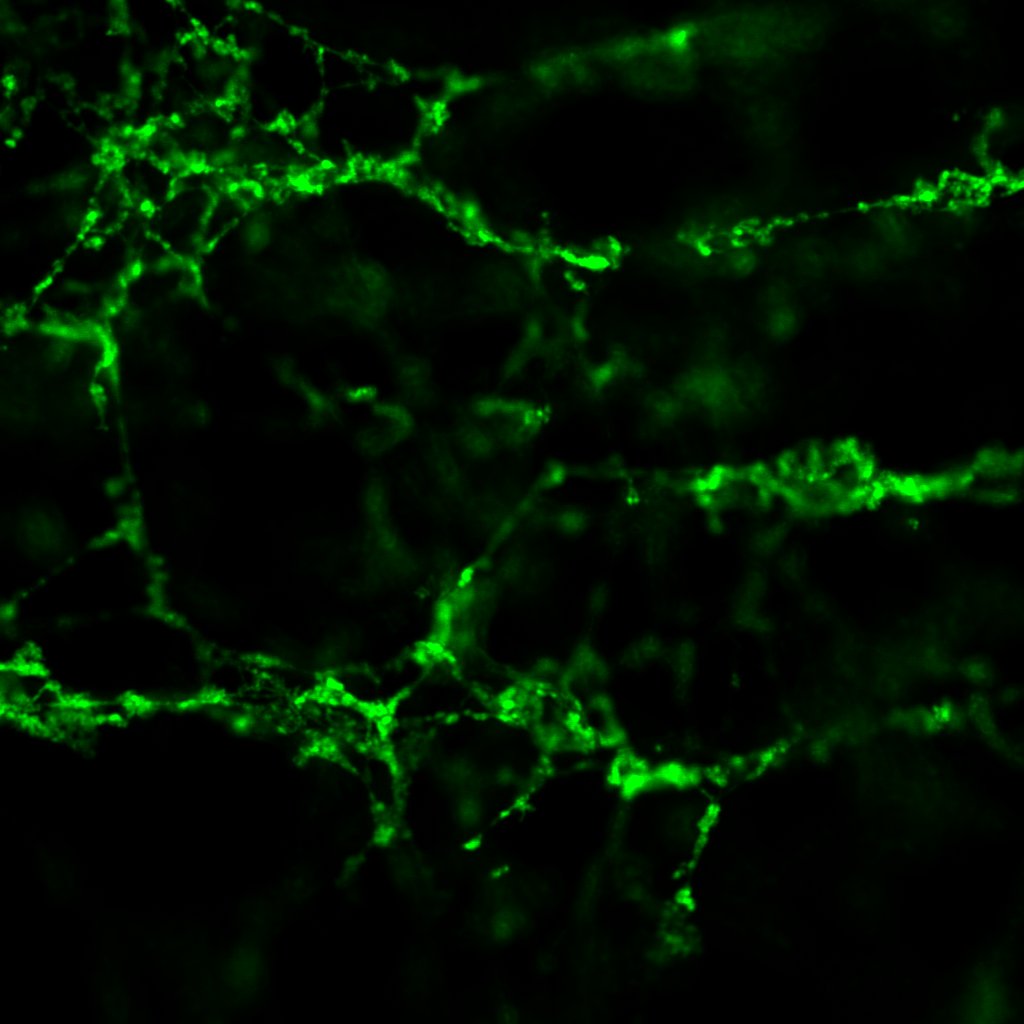
This sample has a very battered appearance, not dissimilar to some of the earliest clots I made last year, when I was honing my lab skills. Lots of broken threads and loose ends are visible. This should not have been the case; we were reliably informed by the haematologists at the Weisel Lab in the Department of Cell and Developmental Biology at UPenn that fibrin meshes do not have loose ends, i.e. you can always trace a path from one point on a clot to any other point on the same clot—quite an astonishing revelation. Normally I image at 4x zoom, which results in raw images at 1024px by 1024px, covering an actual area of 200μm by 200μm. To reduce memory load, typically I crop the canvas to 256px by 256px.
In this case though, while some structure is visible at 1024px by 1024px, cropping to 256px by 256px (or equivalently, zooming in by another 4x) destroys all semblance of structure, leaving only disjointed threads visible. At the original canvas size, I can process a maximum of 50 slices out of the the 240 slices imaged before exhausting 8GB of RAM.
Long story short, it is hard to compare these small-chamber clots to larger clots and draw any meaningful conclusions.
Another suspicion I have long harboured is that the thick clumps that tend to favour the z-axis are not physical; in other words, they could be artifacts of the imaging process. One crucial component of generating a three-dimensional object from two-dimensional images is interpolation. The 3D viewer plugin of Fiji stitches the z-stack together and performs interpolation. The 3D printer also contributes as it slices the 3D model from 3D viewer into a large but finite number of layers. Since the 3D prints all look remarkably close to the models I see on screen though (Doug Willen at Information Technology Services assured me that altering the orientation of the print, i.e. printing the clot on its side, will make no difference), the likely culprit is interpolation by 3D viewer.
I put interpolation to the test by reducing the z-step size at the confocal microscope from 0.21μm to 0.04μm. Excessive photobleaching and my RAM size necessitated a reduction in z-range from 50μm to 10μm. The net result is a fivefold increase in z-resolution and fivefold decrease in z-range.
Ceteris paribus, figure 10 shows the output .stl file.
The output looks virtually indistinguishable from earlier prints. Thick clumps and flat surfaces are still abundantly present. Nonetheless it occurred to me that with the increased resolution available, perhaps it would not be necessary to increase the brightness of the z-stack as I normally would. With a low resolution stack, thinner fibrils that happen to be caught in the gap between slices may fail to register; in such circumstances, it is helpful to increase the brightness in post-processing to include some out-of-focus light so that fainter ropes do not become broken strands during interpolation. My measurements show the typical fibrin rope diameter to be approximately 1μm, which is comparable to a z-step size of 0.21μm.
On the other hand, a z-step size of 0.04μm ought to be well below all but the thinnest of fibrils. So I reprocessed the same z-stack in figure 10, but this time kept the raw brightness/contrast settings from the scope. These settings were determined with the help of the Lookup table (LUT) built into the Leica software controller.
The difference is immediately apparent, even though both models depict one and the same sample. The model in figure 11 is much more porous owing to its much thinner fibrils in the xy-plane. Furthermore, although the infamous flat surfaces are still visible in figure 11 in the xz- and yz-planes, they are smaller; the xz- and yz-planes now look similar to the xy-plane. This is very good news, considering it supports the idea that clots are homogeneous and isotropic. These changes are due to the brightness and contrast settings though; I do not believe the higher resolution made any difference whatsoever.
Wednesday 14 Jun 2017 update: I finally completed a high resolution print of the .stl in figure 11 using the newly acquired 3D printer. The plastic matches figure 11 perfectly. That being said, at the end of the day, all of the 3D models I have made are too clumpy.
At this point, I think it would be wise to put clot-making on pause. Professor Carr Everbach has on multiple occasions reminded me that all of the clots I have ever made look somewhat distinct from the clots that the haematologists at UPenn made. My fibrin fibrils do not look nearly as ropy as they ought to. Another visit to the haematologists is in order.
Here’s a tentative list of questions I would ask:
- Why do my clots look like spider webs rather than ropes? (Show Irina my images, 3D prints and a dummy slide)
- Should clots be isotropic (in vivo and in vitro)? My fibrils look thicker along the z-axis
- (Why) Is dialysis of fibrinogen with NaCl-Tris buffer really necessary? How can the fibrinogen be protected from heat?
- What is the physiological range of clot densities in the human body, i.e. are my sample images representative of clinical conditions?
Until then, au revoir!