Fabricating and 3D printing fibrin clots to understand sonothrombolysis
The following is an almost verbatim transcript of the poster that Professor Carr Everbach and I prepared and that I presented at the 2016 Sigma Xi student poster session at Swarthmore College. The poster was originally titled “Fabricating and 3D-printing fibrin clots to gain insight into sonothrombolysis,” here slightly shortened.
Abstract
Blood clots (thrombi) forming inside the body impede blood flow and can lead to dangerous conditions such as ischaemic stroke [1]. Traditional pharmacologic therapy affects the body systemically, posing additional danger of haemorrhage if the patient has benign blood clots [5].
This risk is reduced with sonothrombolysis—high-amplitude pulsed ultrasound that drives microbubbles into violent oscillations and destroys the fibrin mesh-like structure of a thrombus [2].
Previous research has studied the interactions between ultrasonic microbubbles and thrombi, but made assumptions about the detailed structure of a real thrombus. The purpose of this research was to fabricate fibrin clots in vitro using varying concentrations of the reagent thrombin, image them using a confocal microscope, analyse images and 3D print plastic models.
Image analysis and plastic models demonstrated that increasing thrombin concentration decreases average pore size.
Confocal microscopy
A confocal microscope excites fluorescent dye in a sample and collects light emitted by dyed molecules. It eliminates out-of-focus light with a pinhole and obtains thin optical sections throughout the depth of the sample.
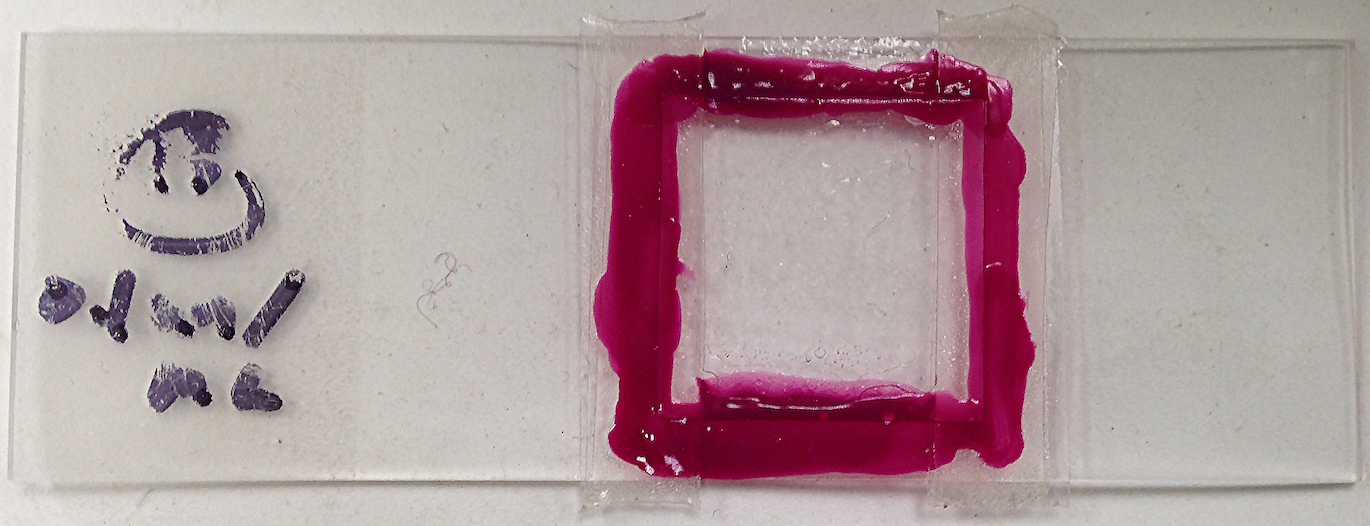 Figure 1: A fully sealed fibrin clot sample, made with 0.1 un/mL thrombin.
Methods
Clot preparation
- Prepare stock solutions of 5 mg/mL fibrinogen, 10 un/mL thrombin, 1.5 mg/mL Alexa Fluor 488 fluorescently-labelled fibrinogen and 0.1 M CaCl2, using pH 7.4 Tris as buffer.
- To make a clot with 0.1 un/mL thrombin concentration, mix 30 μL fibrinogen, 4 μL Alexa, 62 μL Tris, 3 μL CaCl2 and 1 μL thrombin; to make a clot with 0.5 un/mL thrombin concentration, mix in 58 μL Tris and 5 μL thrombin instead; to make a clot with 1.0 un/mL thrombin concentration, mix in 53 μL Tris and 10 μL thrombin.
- Inject the mixture into a chamber on a microscope slide within 10 seconds, then seal the slide with nail polish.
Microscopy
Take 50-by-50 micron-sized sections spanning a depth of 50 microns, using a confocal microscope.
Image analysis and 3D printing
Calculate pore sizes using the Analyze Particles function in Fiji [3].
For each clot, reconstruct .stl file from sections using Fiji, clean up file using MeshLab [4], then 3D print in plastic.
Results
When the confocal micrographs of each fibrin clot were stacked and viewed from above, the clot made from 0.1 un/mL thrombin had the largest pores. Conversely, the clot made from 1.0 un/mL thrombin had the smallest pores and hence the densest structure. 0.5 un/mL thrombin produced a clot of medium density.
The thickness of fibrils could not reliably be analysed due to the limited resolution of confocal micrographs. Higher resolution was achievable but would have led to excessive photobleaching due to the length of time needed to image a larger stack of confocal slices.
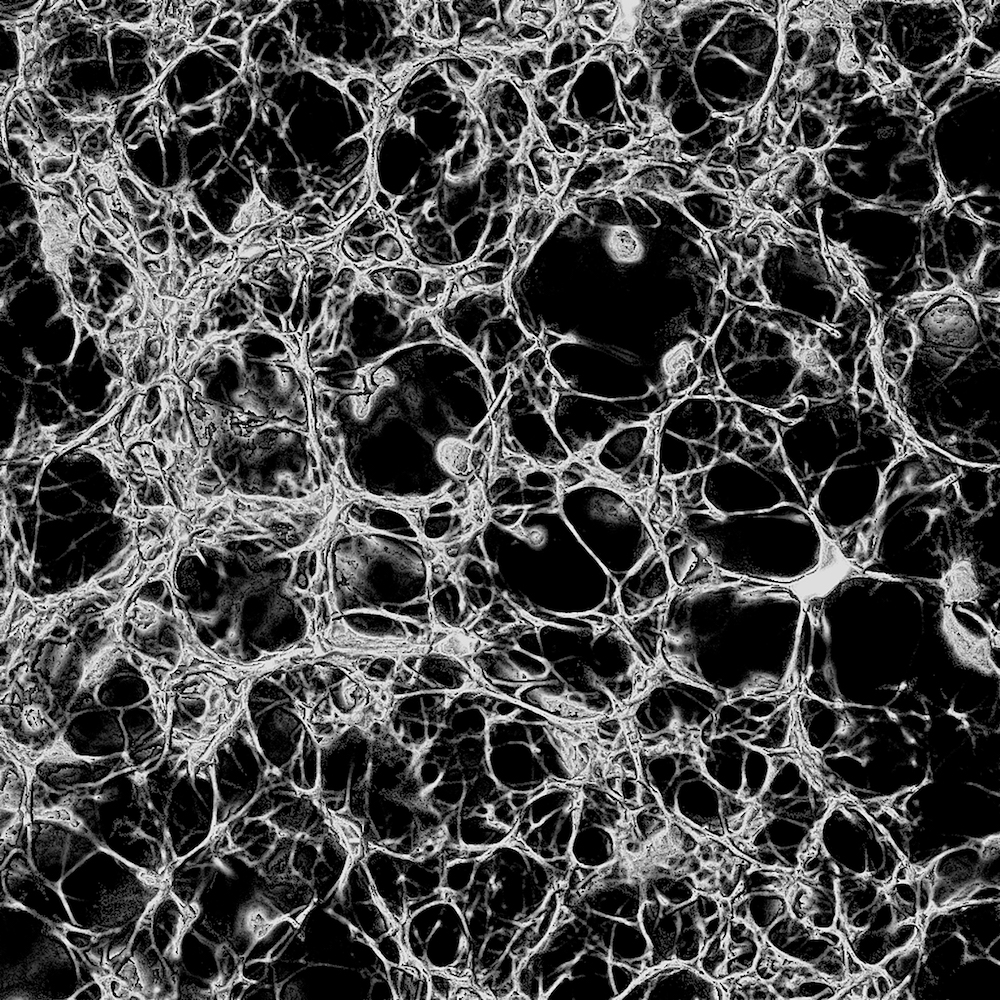 Figure 2: Fibrin clot made from 0.1 un/mL thrombin displayed the most porous mesh. These extended depth-of-field images were reconstructed from confocal sections using the
 3D viewer plugin in Fiji.
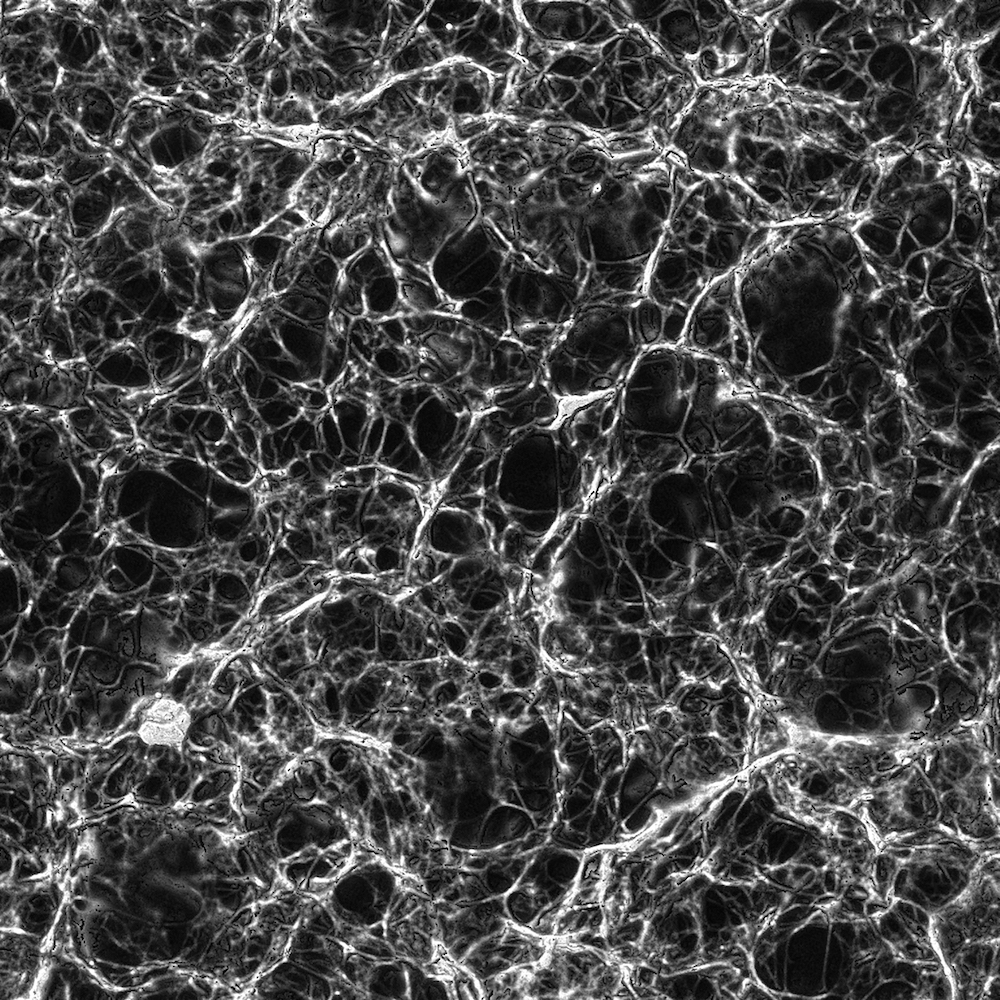 Figure 3: Fibrin clot made from 0.5 un/mL thrombin displayed a medium density mesh.
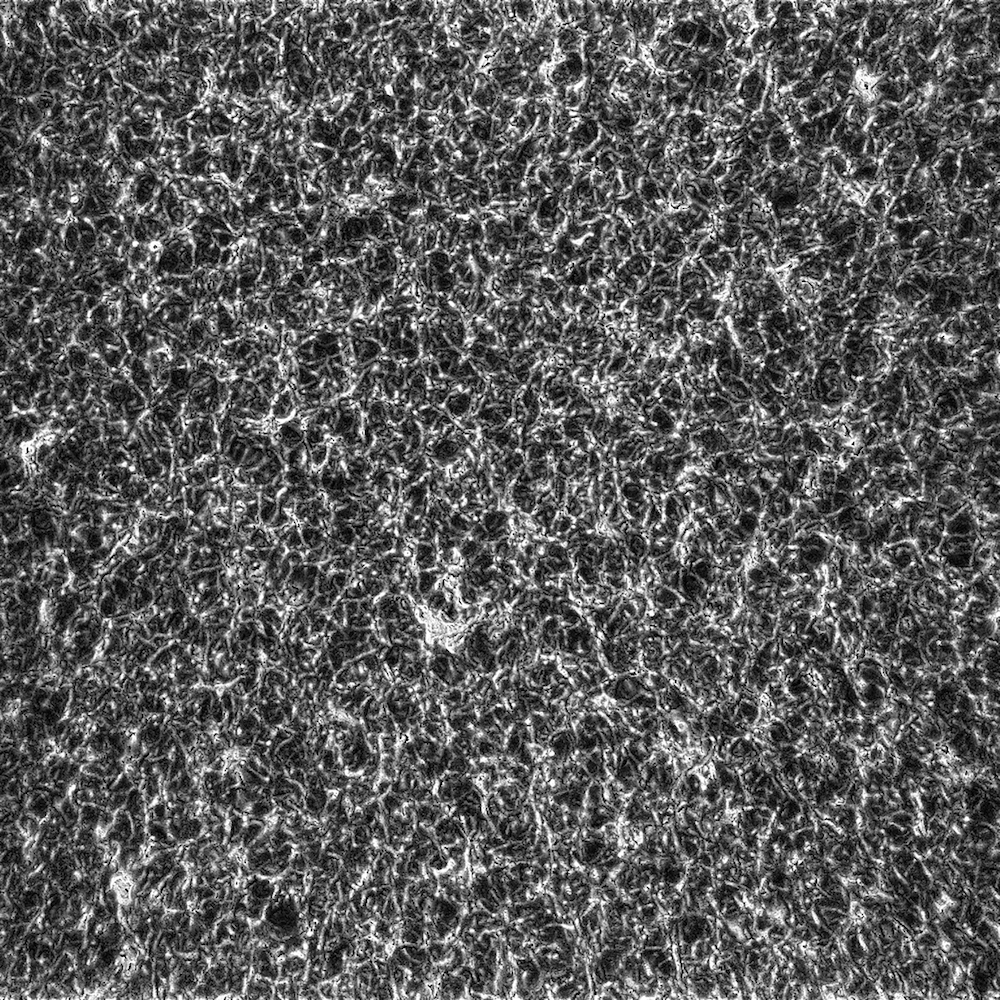 Figure 4: Fibrin clot made from 1.0 un/mL thrombin displayed the smallest pores and densest mesh.
3D printed plastic models suggested the same distinct reduction in porosity as thrombin concentration increased. Although fibrils in the plastic models appeared to become thinner with more thrombin, thick fibrils in these models often resulted from clumps of thinner fibrils that failed to be resolved.
Visually, the plastic models showed that fibrin structure was isotropic—pore size was approximately equal in every spatial direction.
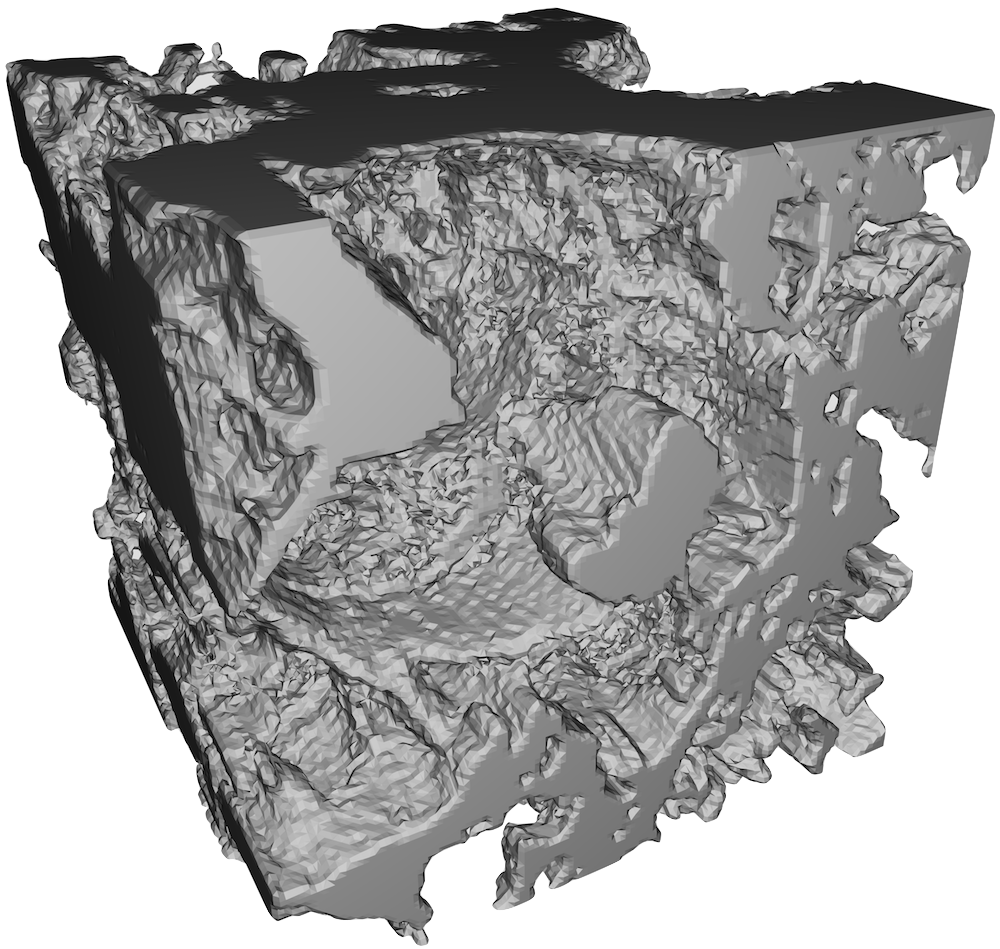 Figure 5: Fibrin clot made from 0.1 un/mL thrombin. Note the large amount of empty space—or pores, as well as the thicker fibrils.
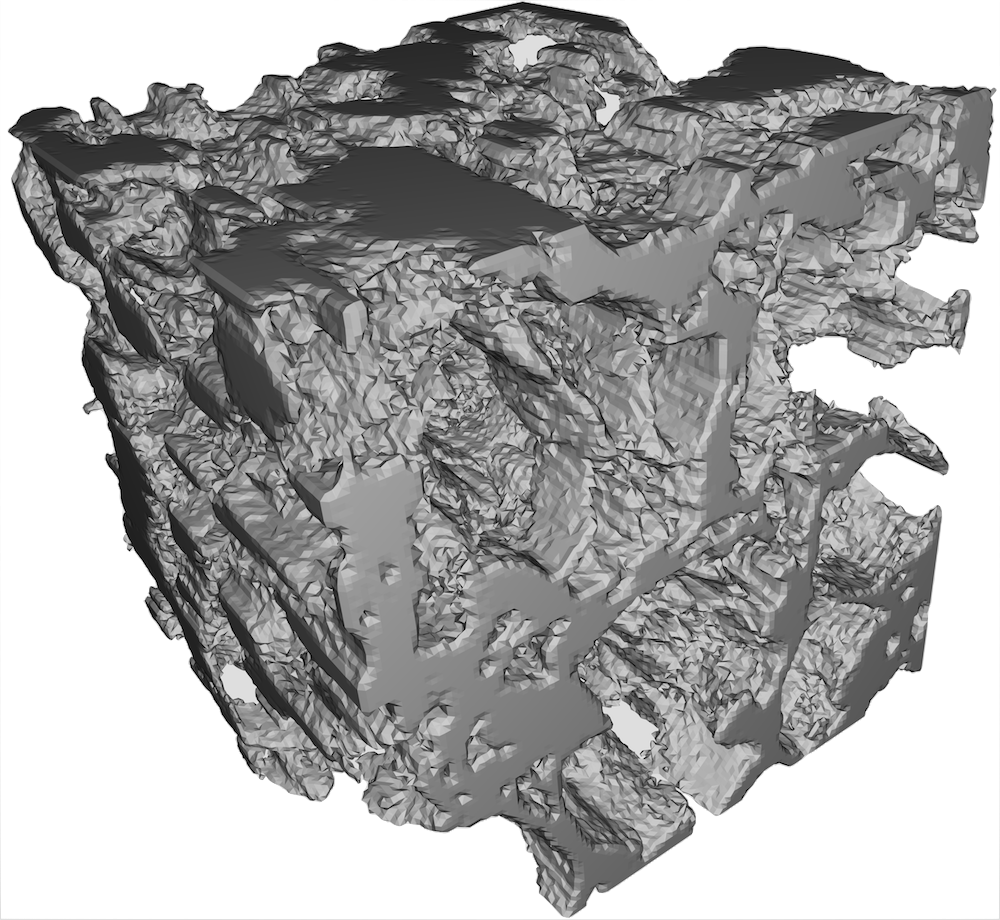 Figure 6: Fibrin clot made from 0.5 un/mL thrombin. Pores were smaller and more numerous than they were in the 0.1 un/mL clot, and fibrils were thinner.
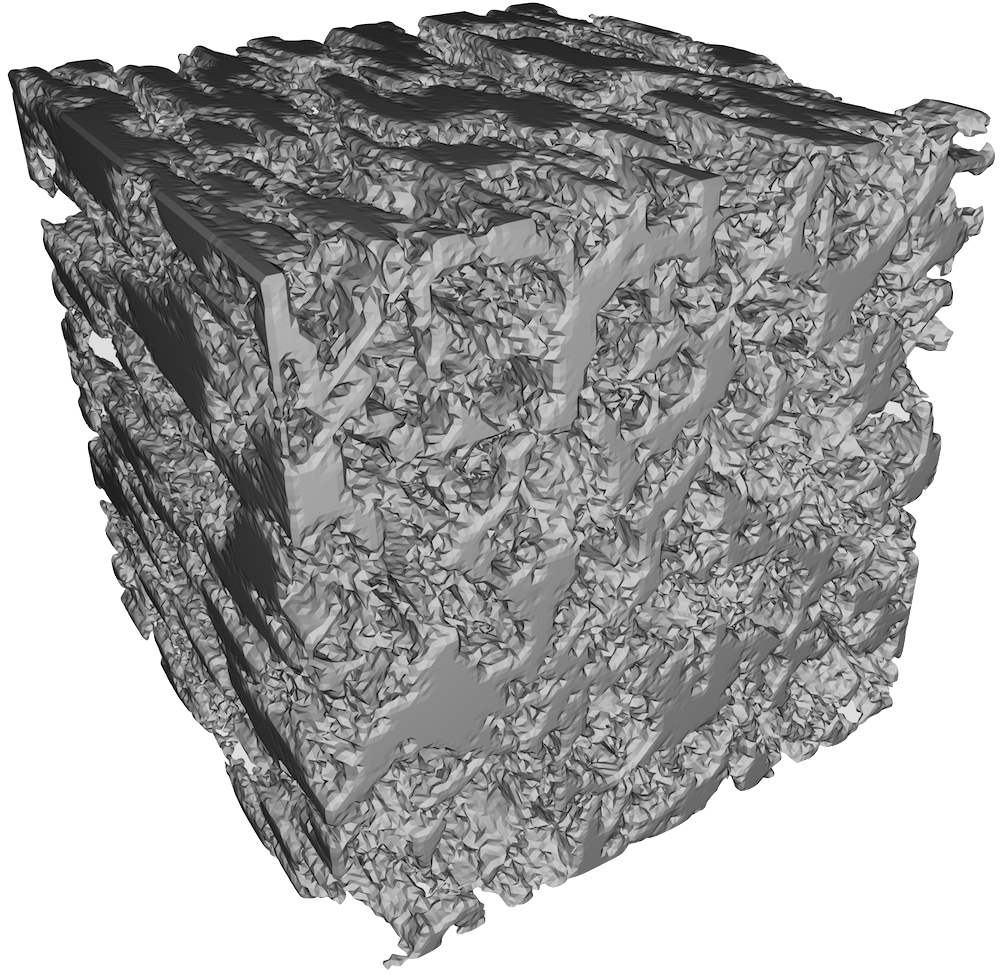 Figure 7: Fibrin clot made from 1.0 un/mL thrombin. This clot had the smallest pores and thinnest fibrils.
The Analyze Particles function in Fiji calculated the mean pore size for the 0.1 un/mL, 0.5 un/mL and 1.0 un/mL clots to be 61.49 micron2, 44.39 micron2 and 12.74 micron2, respectively.
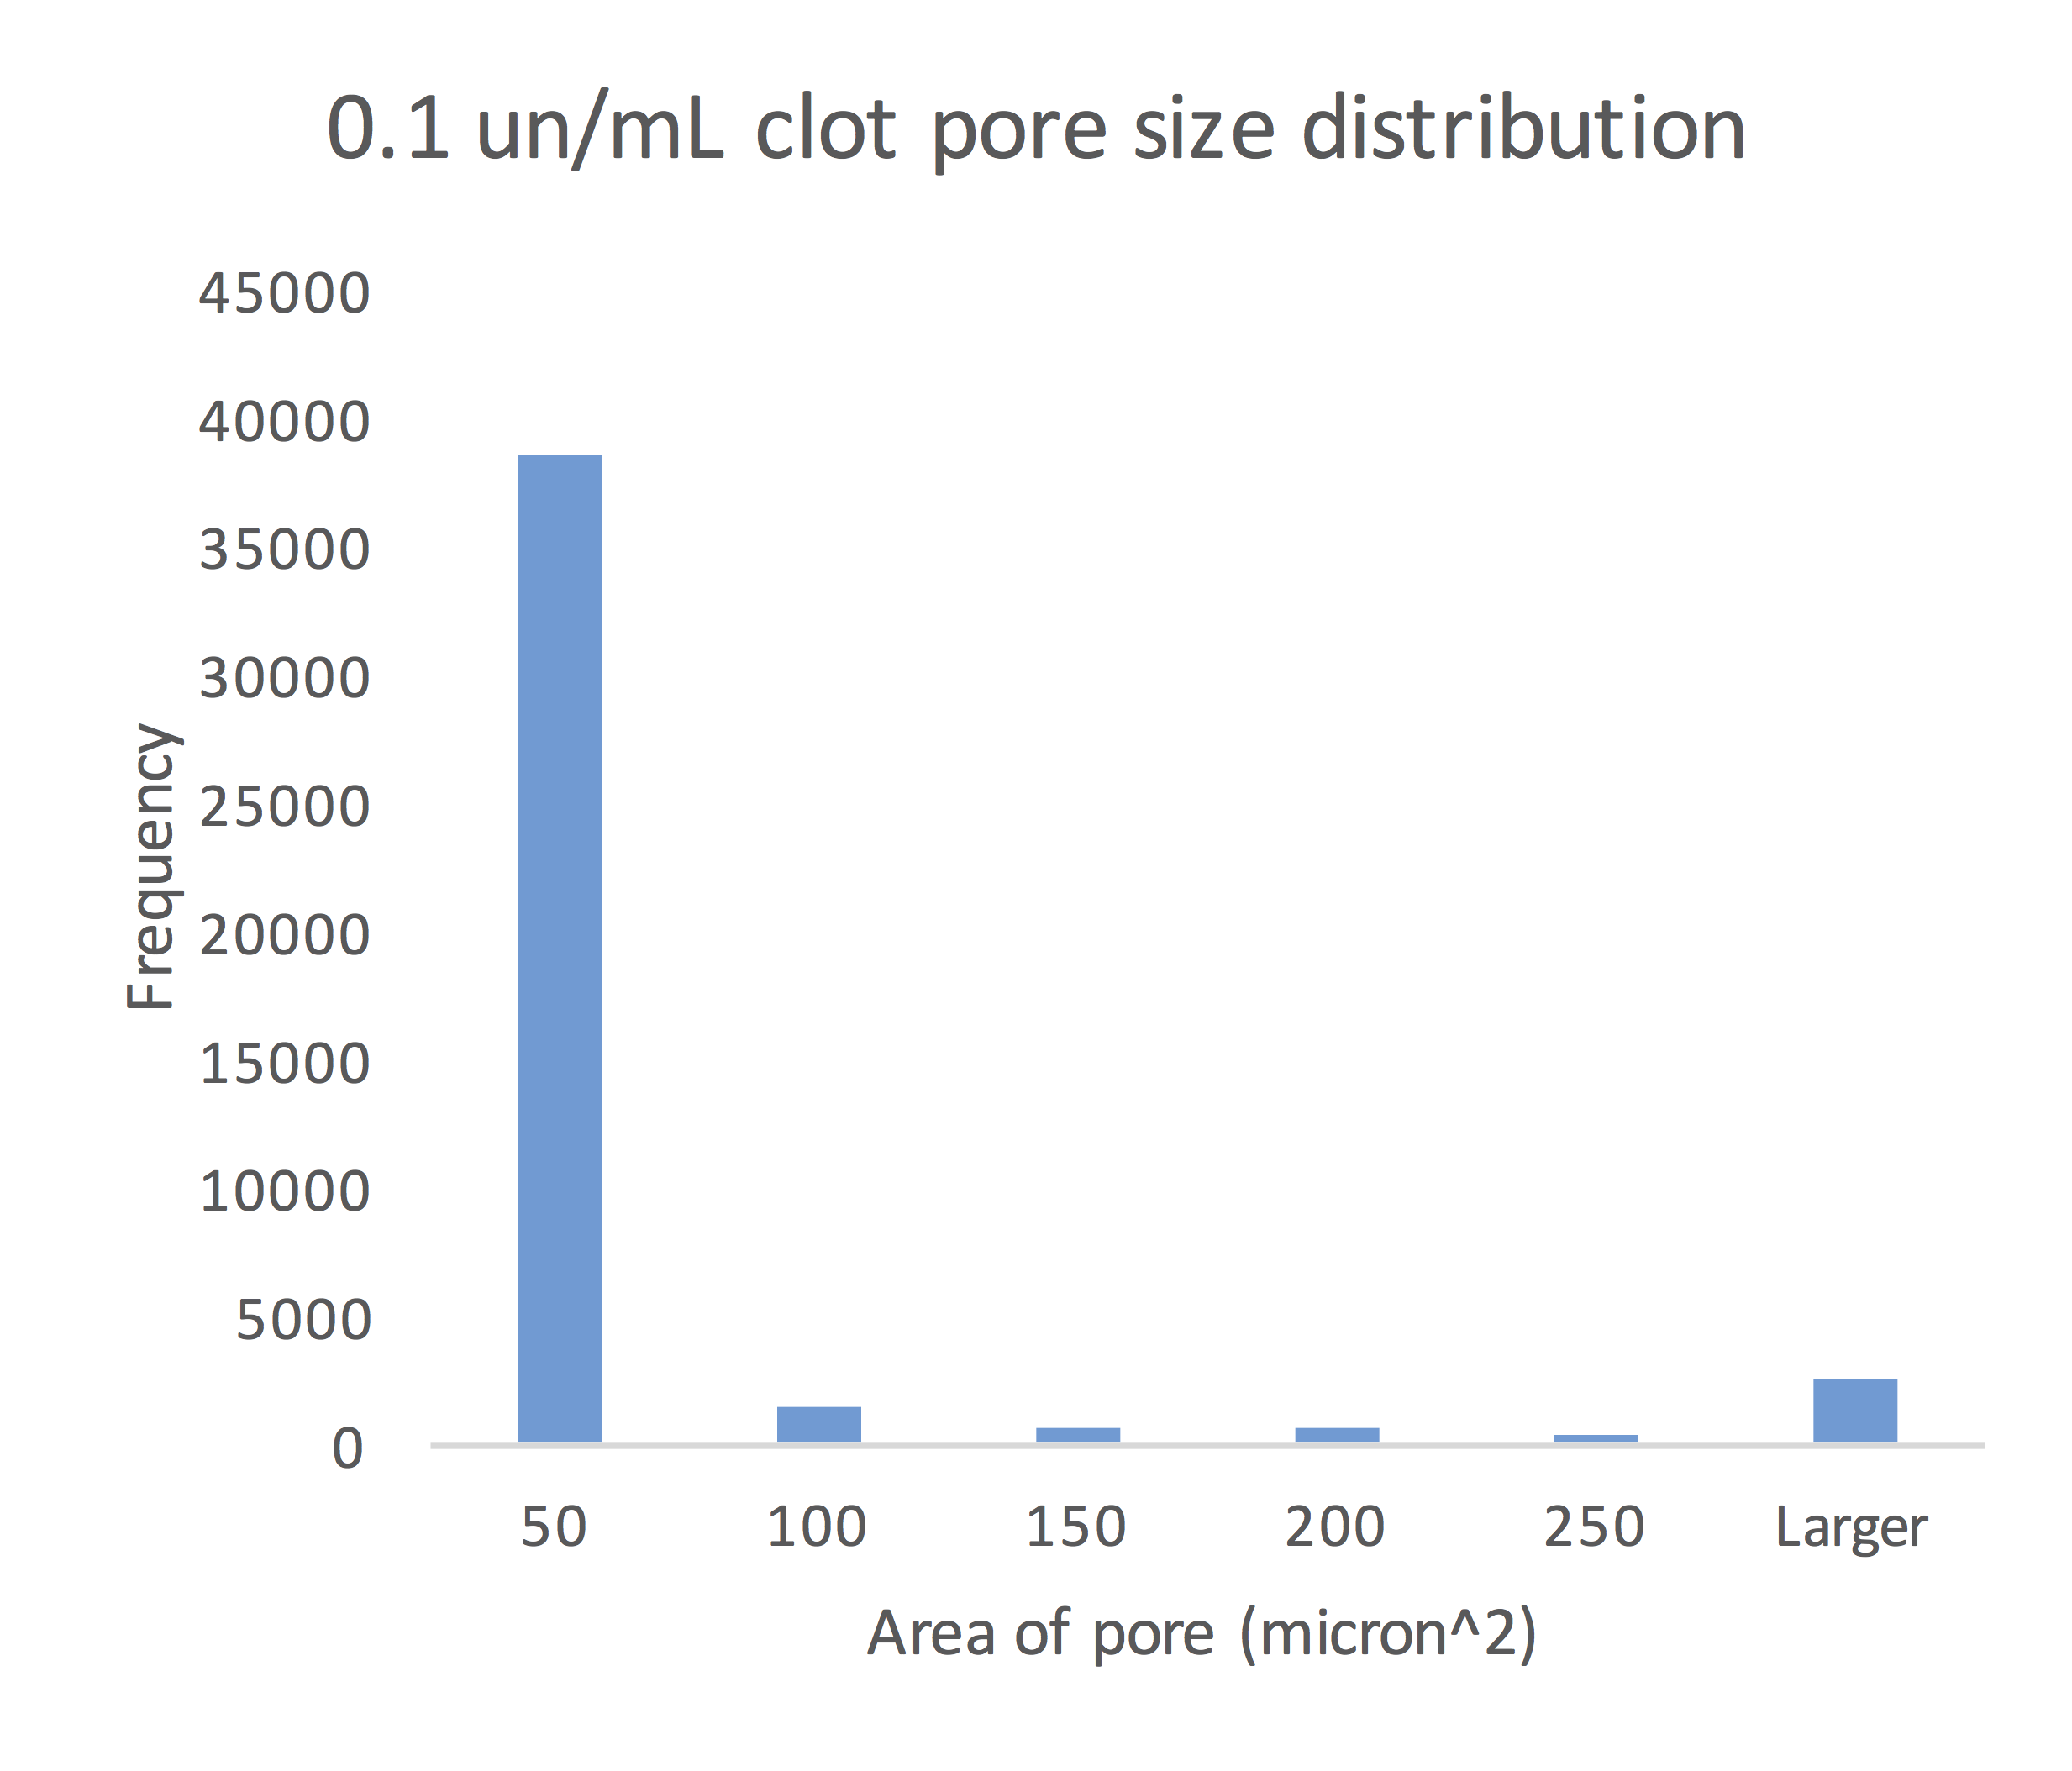 Figure 8: Size of pores in the 0.1 un/mL clot congregated around the mean pore size of 61.49 micron2.
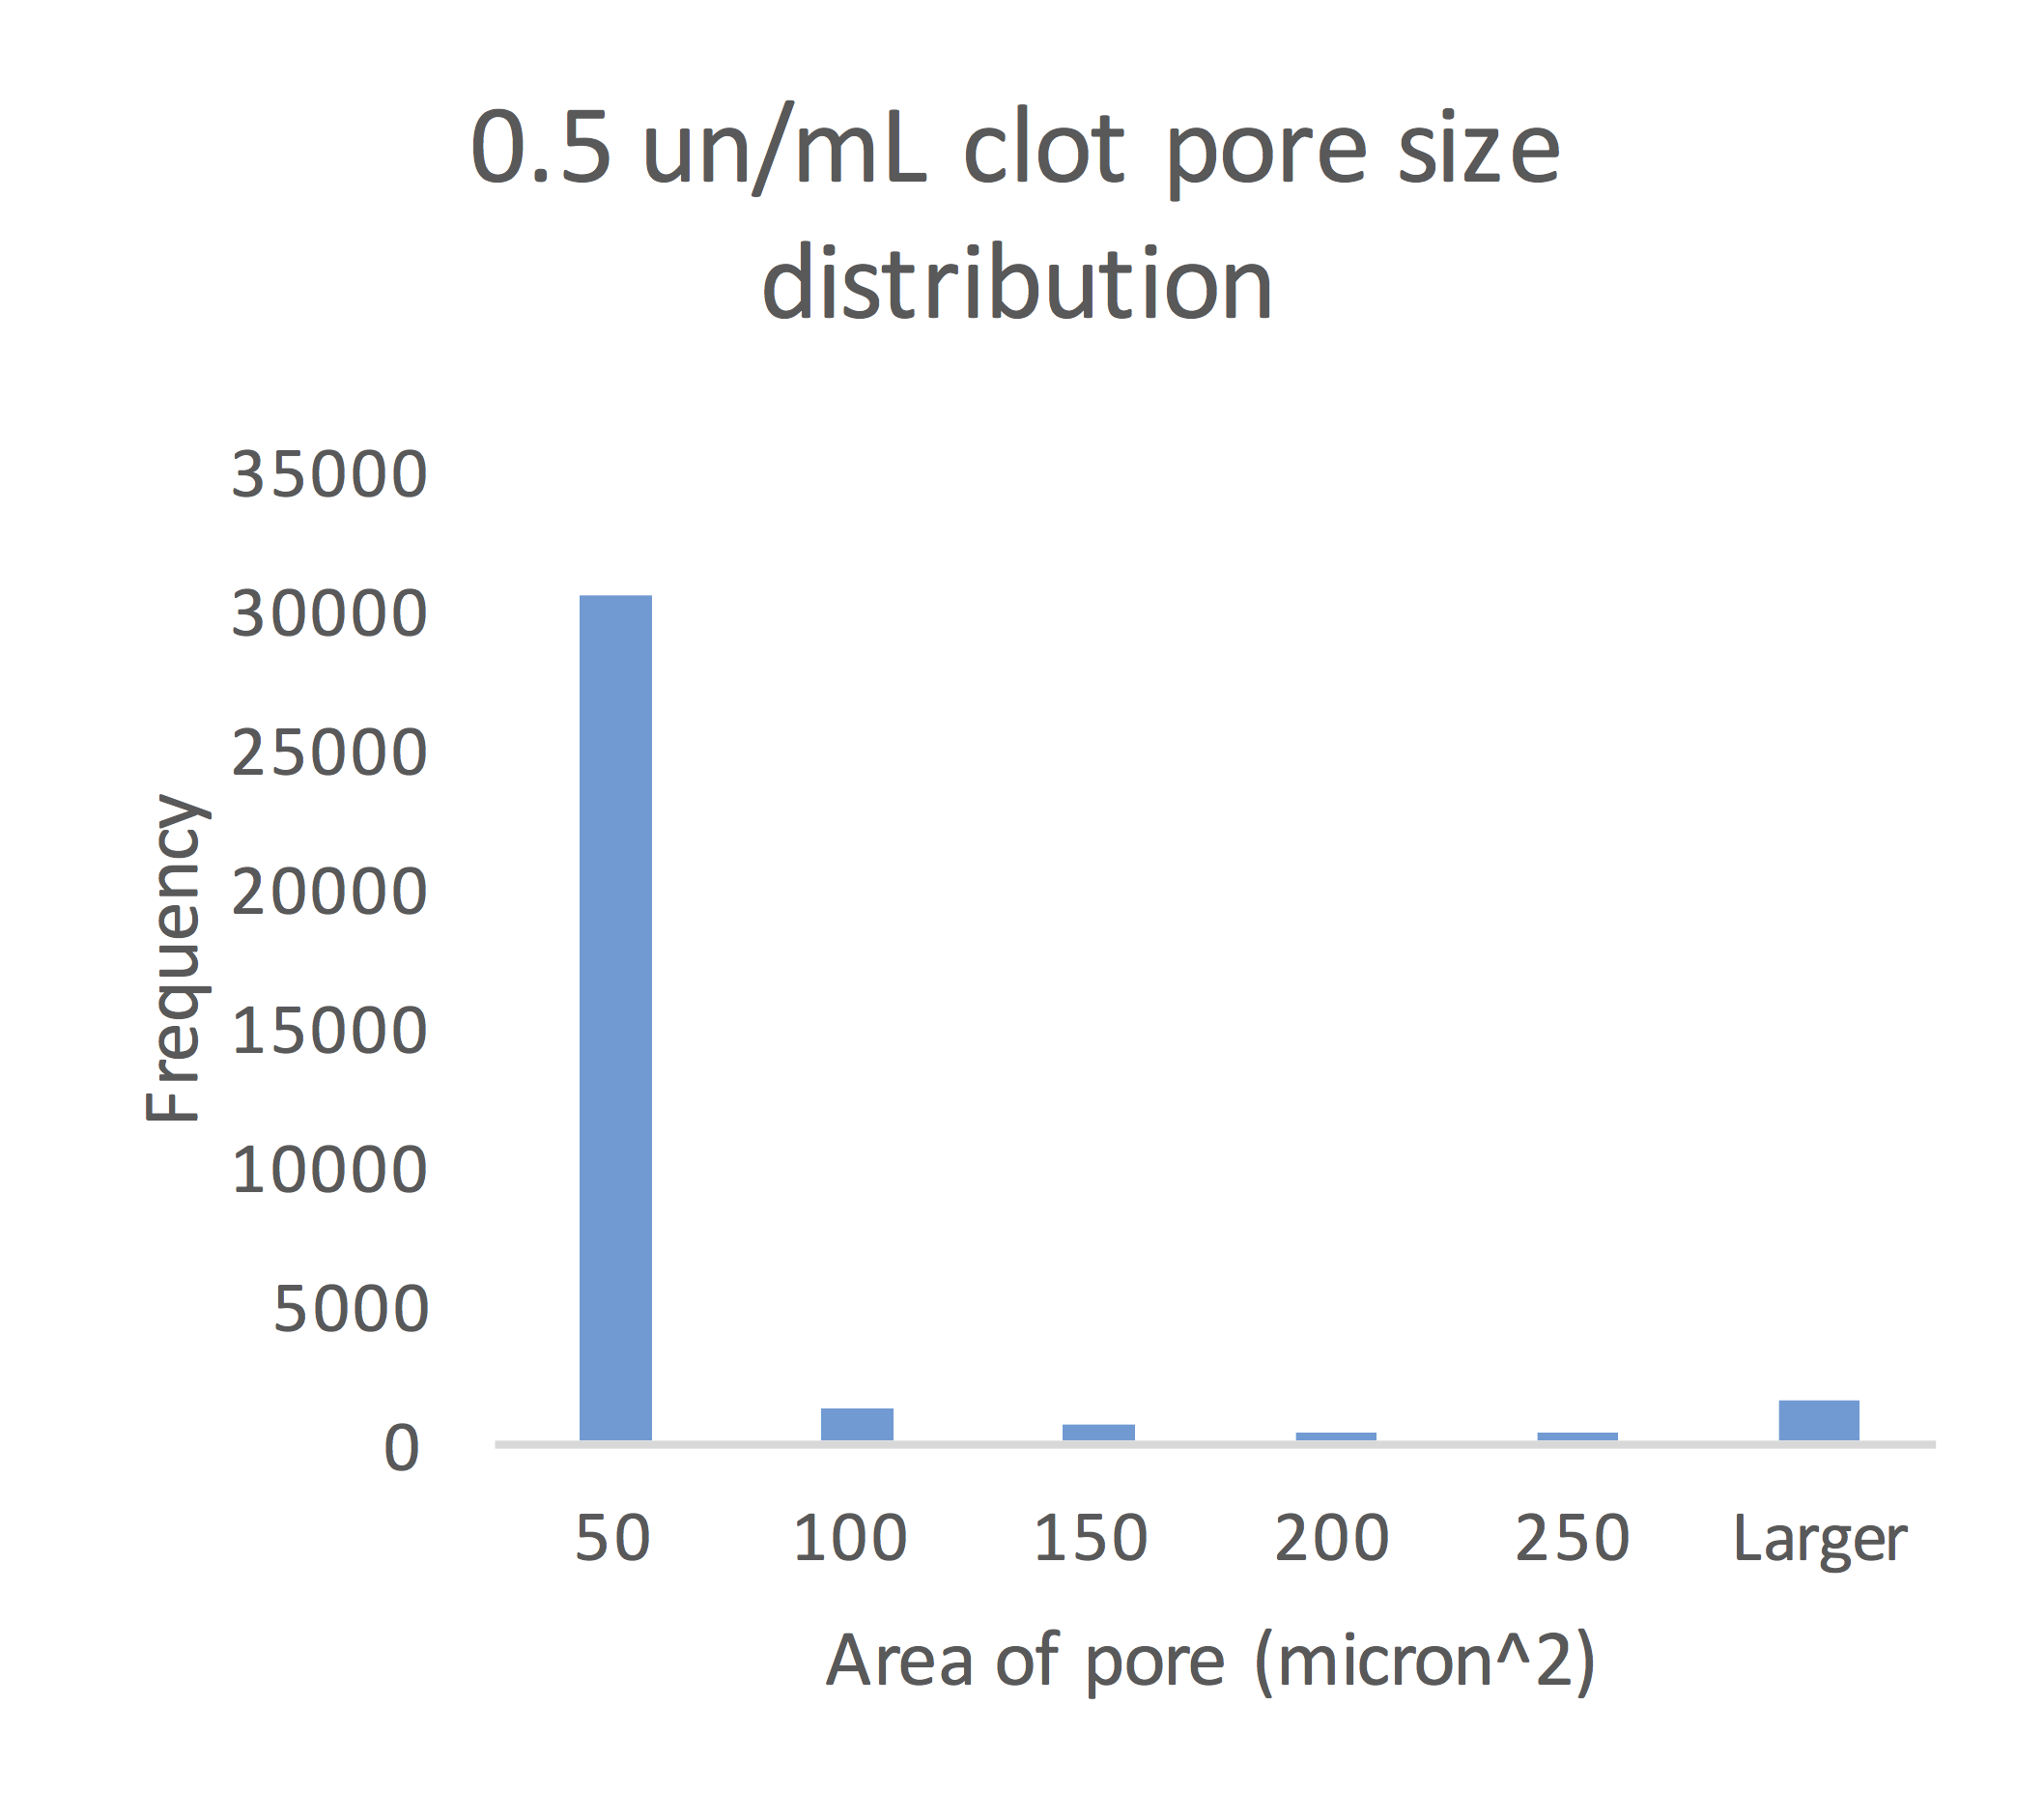 Figure 9: Size of pores in the 0.5 un/mL clot congregated around the mean pore size of 44.39 micron2.
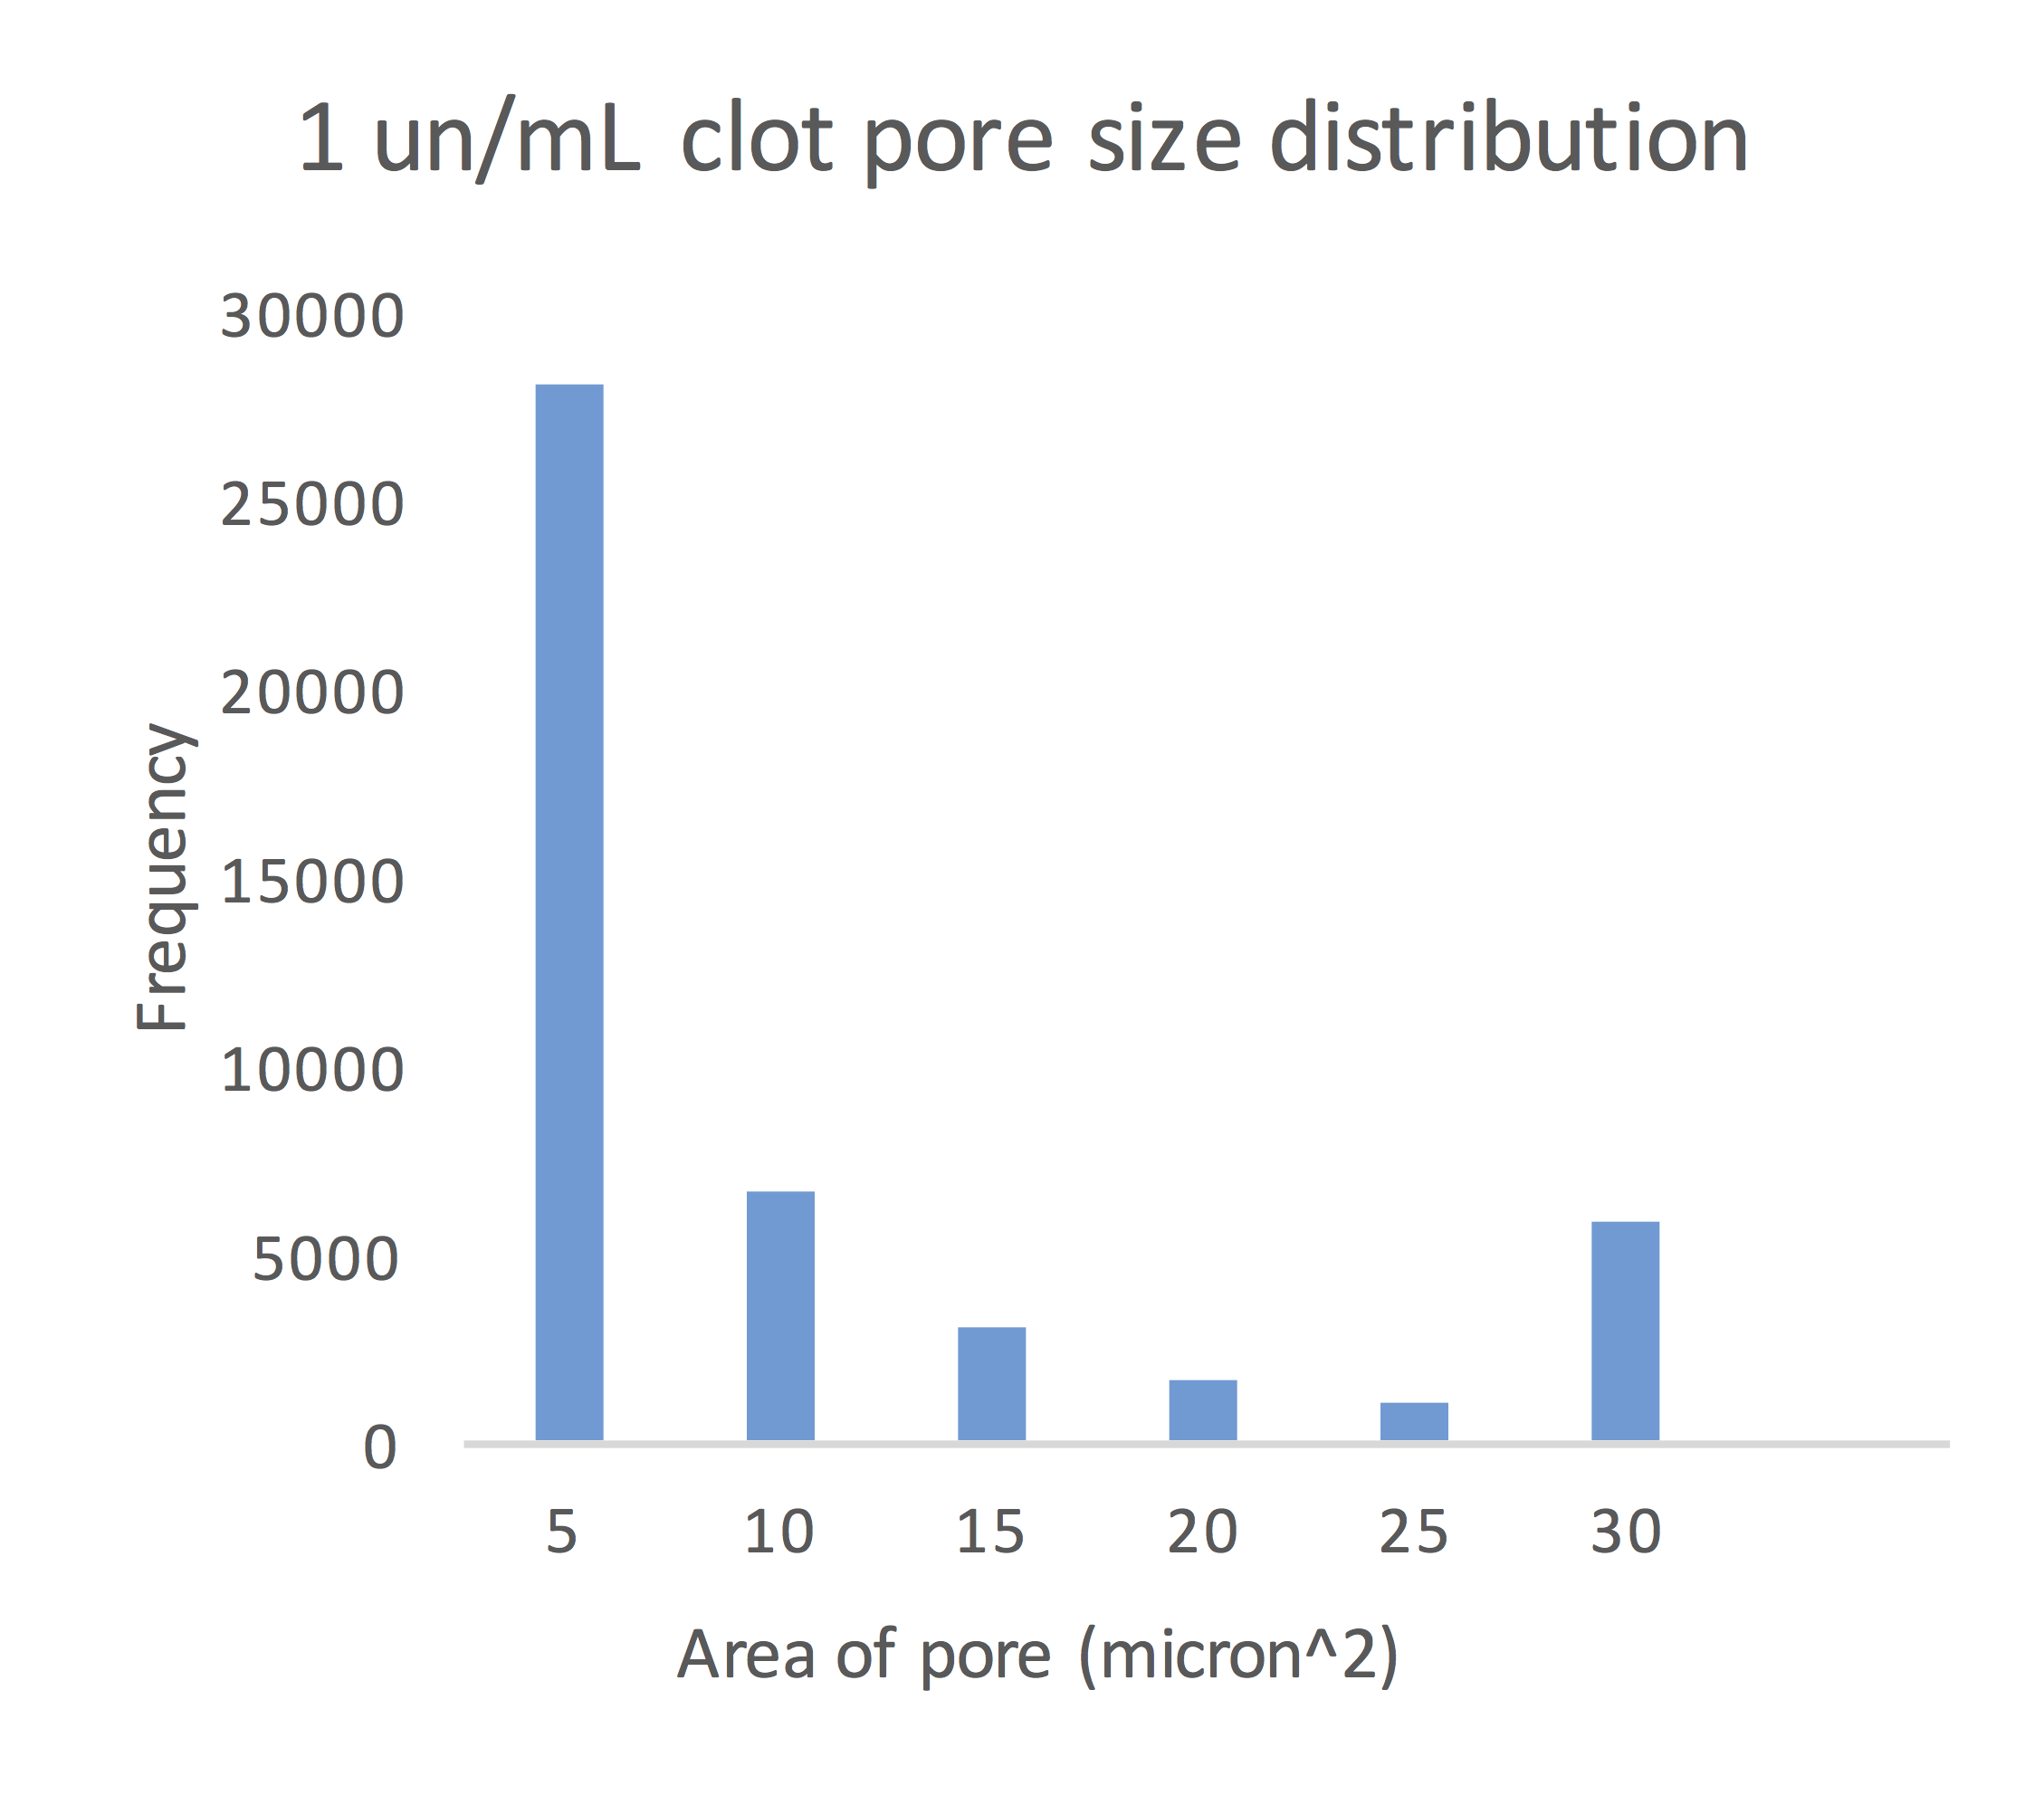 Figure 10: Size of pores in the 1.0 un/mL clot congregated around the mean pore size of 12.74 micron2.
Each clot showed significant variations in pore sizes, though the majority of pores in each clot were clustered around the mean pore size.
Conclusions
Realistic three-dimensional models of artificially produced fibrin clots can be reconstructed from optical sections imaged with a confocal microscope.
Increasing the concentration of thrombin decreases the average pore size and increases the density of the fibrin mesh fabricated.
In each clot, pore size possessed no discernible directional preference.
References
- A. E. X. Brown, R. I. Litvinov, D. E. Discher, P. K. Purohit, J. W. Weisel, “Multiscale mechanics of fibrin polymer: gel stretching with protein unfolding and loss of water,” Science, vol. 325, no. 5941, pp. 741–744, 2009.
- C. Acconcia, B. Y. C. Leung, K. Hynynen, D. E. Goertz, “Interactions between ultrasound stimulated microbubbles and fibrin clots,” Appl. Phys. Lett., vol. 103, no. 5, pp. 053701, 2013.
- J. Schindelin, I. Arganda-Carreras, E. Frise, V. Kaynig, M. Longair, T. Pietzsch, S. Preibisch, C. Rueden, S. Saalfeld, B. Schmid, J. Tinevez, D. J. White, V. Hartenstein, K. Eliceiri, P. Tomancak, A. Cardona, “Fiji: an open-source platform for biological-image analysis,” Nat. Methods, vol. 9, no. 7, pp. 676–682, 2012.
- P. Cignoni, M. Callieri, M. Corsini, M. Dellepiane, F. Ganovelli, G. Ranzuglia, “MeshLab: an Open-Source Mesh Processing Tool,” Sixth Eurographics Italian Chapter Conference, pp. 129–136, 2008.
- The National Institute of Neurological Disorders and Stroke rt-PA Stroke Study Group, “Tissue plasminogen activator for acute ischemic stroke,” N. Eng. J. Med, vol. 333, pp. 1581–1588, 1995.
Acknowledgements
This project built on the prior work by Professor Carr Everbach and his students, Ascanio Guarini, Atousa Nourmahnad and Luke Barbano. I would like to thank Professor Everbach for his guidance and mentorship throughout the entirety of the project. I would also like to thank Irina Chernysh for providing detailed instructions for preparing fibrin clots, and Professor Elizabeth Vallen for training me to use the confocal microscope. This project was supported by the Deborah A. DeMott ’70 Student Research & Internship fellowship.